new website for APL and PKMP
Interspecies scaling in pharmacokinetics allow the prediction of in vivo drug disposition behavior in human from the experimental observations made in one or more species. Interspecies scaling of the pharmacokinetic processes of absorption, distribution, and clearance of drugs can be performed by allometry. The allometric approach involves estimation of the pharmacokinetic parameters – clearance (CL), half-life, volume of distribution (Vd) etc. – in humans based on their relationship to body mass in several test animal species. PKMP interspecies scaling module includes the following methods for prediction of human pharmacokinetics and estimating a maximum safe starting dose (MSSD) in initial clinical trials for drugs in human subjects as per the FDA guidance.
In this method pharmacokinetic data after intravenous administration of a drug in three or more animal species is needed. Intravenous data is preferred for the complete bioavailability of a drug, although extravascular route PK data can be used with consideration to differences in bioavailability across the species. In this method pharmacokinetic parameters, CL and Vd, among animal species are correlated as exponential functions of body weight or body surface area using the simple allometric equation
Y=aWb
or its logarithmic transformation.
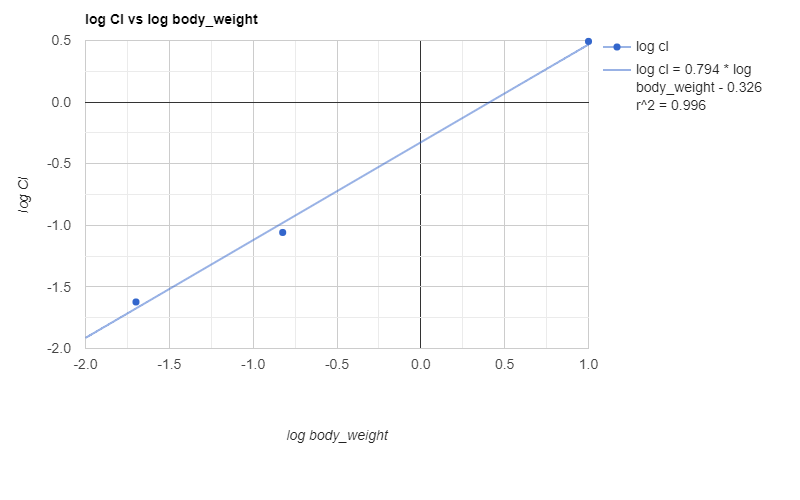
log Y = log a + b log W
Where Y is a pharmacokinetic parameter, W is body weight, a is the allometric coefficient, and b is the allometric exponent. A plot of log CL vs log W is shown below.
Human predicted PK parameters based on allometric scale up are shown below.
| Dose | Kel | Body Weight | Body Surface Area | T1/2 | AUC 0-inf | Cl/F | Vd/F | Cmax | tau | Cavg |
|---|---|---|---|---|---|---|---|---|---|---|
| mg/kg | 1/hr | kg | m^2 | hr | mg/L*hr | L/hr | L | mg/L | hr | mg/L |
| 1.0 | 0.156 | 60.0 | 1.62 | 4.4 | 4.931 | 12.2 | 78.1 | 0.769 | 24 | 0.205 |
In this method PK parameters from animal species are converted to human parameters or animal parameters using the BSA ratio extrapolation. Prediction of human parameter from each species as well as average from all species is calculated as shown below.
| Species | Human Body Surface Area | Human Body Weight | Human Dose | Body Surface Area Ratio | Dosing frequency (tau) | AUC(0-inf) | Cavg | CL | Vd | Cmax |
|---|---|---|---|---|---|---|---|---|---|---|
| Units | m2 | kg | mg/kg | hr | mcg*hr/ml | mcg/ml | mL/hr | L | mcg/ml | |
| Mouse | 1.6 | 60.0 | 1.0 | 231.4 | 24 | 2.6 | 0.1 | 23143 | 23.1 | 2.6 |
| Rat | 1.6 | 60.0 | 1.0 | 64.8 | 24 | 18.5 | 0.8 | 3240 | 32.4 | 1.9 |
| Dog | 1.6 | 60.0 | 1.0 | 3.2 | 24 | 740.7 | 30.9 | 81.0 | 94.3 | 0.6 |
| Mean | 254.0 | 10.6 | 8821 | 49.9 | 1.7 | |||||
| SD | 421.6 | 17.6 | 12503 | 38.7 | 1.0 | |||||
| Using Average Value | 60.0 | 1.0 | 6.8 | 0.3 | 1.2 |
Human equivalent dose (HED) from animal no observed adverse effect level (NOAEL) is calculated as per the FDA guidance using:
HED = animal NOAEL/HED factor
or
HED = animal NOAEL x (Wanimal/Whuman)(1-b)
Where,
W=body weight
b=allometric exponent
HED data is presented in table below.
| Species | HED | +20% | -20% | Human Body Weight | Dose |
|---|---|---|---|---|---|
| Units | mg/kg | mg/kg | mg/kg | kg | mg |
| Rat | 8.1 | 9.7 | 6.5 | 60.0 | 483.9 |
| Mouse | 8.1 | 9.8 | 6.5 | 60.0 | 487.8 |
| Dog | 5.6 | 6.7 | 4.4 | 60.0 | 333.3 |
This module computes dose escalation schemes for the Phase 1 clinical studies based on starting dose from animal NOAEL.
| Empiric | Fibonacci | Log | ||||||
|---|---|---|---|---|---|---|---|---|
| Dose No. | Factor | Dose Value | Dose No. | Factor | Dose Value | Dose No. | Factor | Dose Value |
| 1 | 1 | 10 | 1 | 1 | 10 | 1 | 0 | 10 |
| 2 | 2 | 20 | 2 | 0.65 | 17 | 2 | 0.5 | 16 |
| 3 | 1.5 | 30 | 3 | 0.52 | 25 | 3 | 1 | 27 |
| 4 | 1.3 | 39 | 4 | 0.4 | 35 | 4 | 1.5 | 45 |
| 5 | 1.3 | 51 | 5 | 0.29 | 45 | 5 | 2 | 74 |
| 6 | 1.3 | 66 | 6 | 0.33 | 60 | 6 | 2.5 | 122 |
| 7 | 1.2 | 79 | 7 | 0.33 | 80 | 7 | 3 | 201 |
| 8 | 1.1 | 87 | 8 | 0.33 | 107 | 8 | 3.5 | 331 |